
 Friends know that I have been studying patterns of church growth for the last 30 years and my background in science and computing lets me do all kinds of things with statistics. A few years ago I did some work for EBA Council on church growth in our churches. This brief paper from Novemver 2014 sums up the findings.
Rev Sheila Martin analysed the membership statistics of EBA churches which had received Home Mission grants during the period from 2004 to 2014. In that she discovered that 38% of those churches had grown in membership while they were receiving support from Home Mission. To understand that statistic, it is necessary to consider those churches in the context of the membership statistics of all the EBA churches.
This brief study has considered the memberships recorded in the EBA handbooks of the 170 churches which were in EBA both in 2004 and in 2014. 40 churches received Home Mission Grants for Mission Through Ministry at some point during that period. The study could not consider Church 123 in Harold Hill, 57 West in Southend or Bacton Beacon Community Church because these did not exist in 2004 or did not record membership in 2014. However Home Mission Grants clearly enabled these churches to come into existence and so each of them are clear evidence for growth due to HM support.
The most important thing to remember is that the total membership of EBA churches declined from 12,513 in 2004 to 11393 in 2014, which was a drop of 9%. Over that period only 32% of all the EBA churches grew in membership. In general smaller churches grew less than larger churches. Considering the churches with membership of less than forty either in 2004 or in 2014 or both (which include almost alll of the churches which received a HM Grant) only 29% of those churches grew in that period. In contrast, 43% of churches receiving a Grant at some point grew during that period.
For this study for each church we defined
“Growth” = Membership in 2014
Membership in 2004
So a church which does not change in membership has Growth of 1. Doubling would have Growth = 2. Halving would have Growth = 0.5.
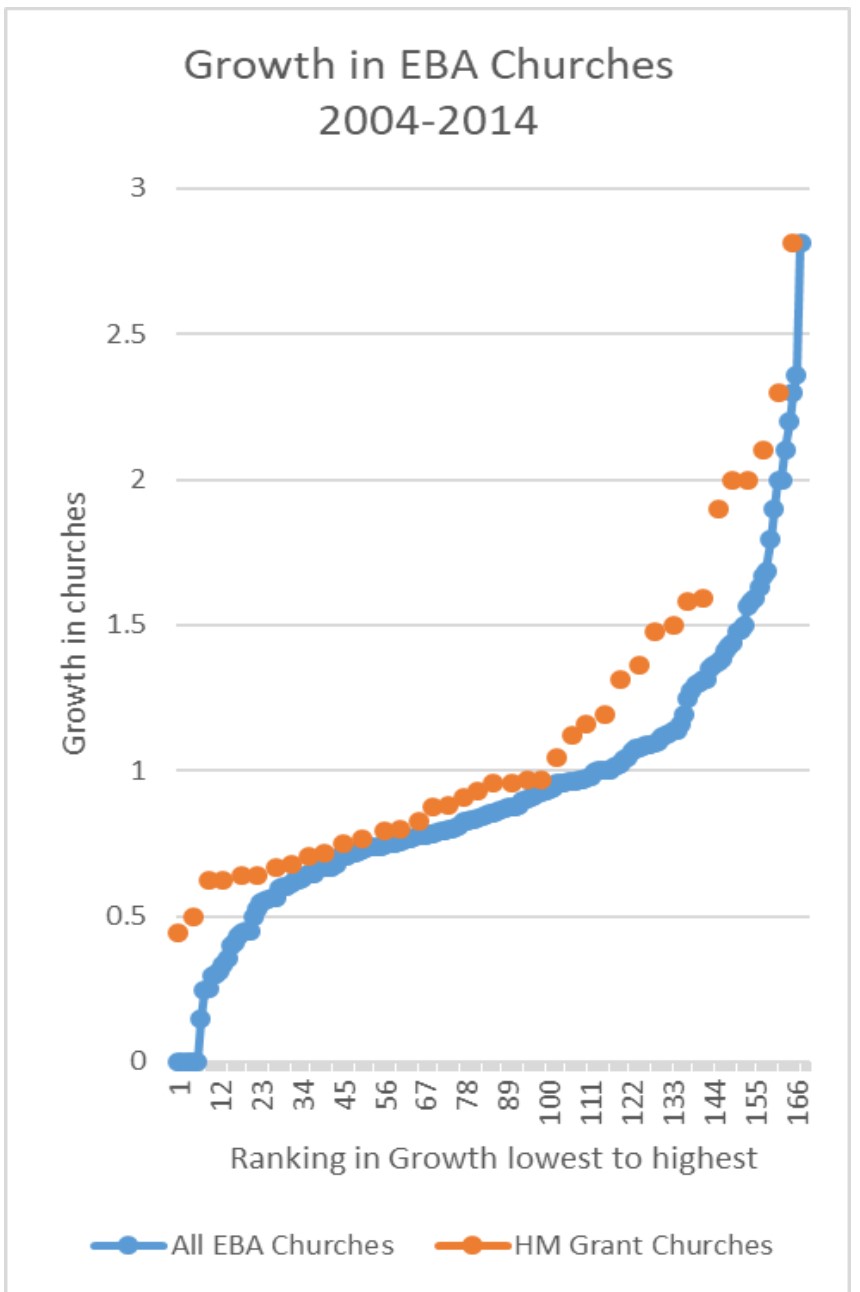
The graph shows the values of Growth for the churches ranked from low to high from left to right. The key points to note from the graph are these.
The proportion of all churches with Growth greater than 1 was 32%. However the proportion of HM Grant churches with Growth greater than 1 was 43%. So proportionately more Grant assisted churches increased their membership.
Half of all EBA churches showed
Growth = 0.86 or more.
But half of all HM Grant churches showed
Growth = 0.96 or more. That is better growth.
The top quarter of all churches had Growth higher than 1.09.
But the top quarter of HM Grant churches had Growth better than 1.5. That is better growth.
The bottom quarter of all churches had Growth under 0.67.
But the bottom quarter of HM Grant churches had Growth under 0.75. That is less decline.
This study demonstrates that between 2004 and 2014 those churches in EBA which received HM Grant support showed significantly greater increases in membership, or less declines in membership, than EBA churches overall. This was in the context of overall declines in membership and especially among smaller churches. These results are statistically significant and the spreadsheet of raw membership statistics is available for anybody who enjoys Excel. Home Mission Grants enabling small churches to have a minister make a measurable difference!